
There are a lot of customer support and satisfaction metrics out there.
These metrics have different levels of importance for companies in different stages. They also require different levels of effort for both you and your customers.
If you’re just starting out with gathering user satisfaction feedback, you probably want something easy and straightforward. You can make it easier with a good user feedback platform.
There’s a simple metric out there that gives you a good, easy snapshot of your customers’ satisfaction — NPS.
Also known as net promoter score, NPS is one of the easiest feedback methods to implement right off the bat.
In this post we’re going to talk about what NPS is, what it consists of, and how to handle the results.
What is Net Promoter Score (NPS)?
NPS is a scale of how likely people are to recommend your product or service to others — aka how likely they are to be “promoters” of your company.
The NPS calculation uses the answers to this question:
How likely are you to recommend our company/product/service to a friend or colleague?
The answer is a scale of 1 to 10, with 10 being “extremely likely”, and 0 being “not at all likely”.
Most NPS surveys also include a comment box after the rating – to give the respondent a change to explain the score if they want to. This is an excellent source of additional and more accurate customer feedback.
If a customer chooses not to leave a comment, you can usually contact them through email to discuss their score further (if they’re willing).
Here’s an example of our NPS in action:

Based on their score, users fall into three categories:
- Promoters (score 9-10)
- Passives (score 7-8)
- Detractors (score 0-6)
Satmetrix, the company behind the idea of NPS, defines these categories like so:
- Promoters are loyal enthusiasts who will keep buying and referring others, fueling growth.
- Passives are satisfied but unenthusiastic customers who are vulnerable to competitive offerings and customer churn.
- Detractors are unhappy customers who can damage your brand and impede growth through negative word-of-mouth.
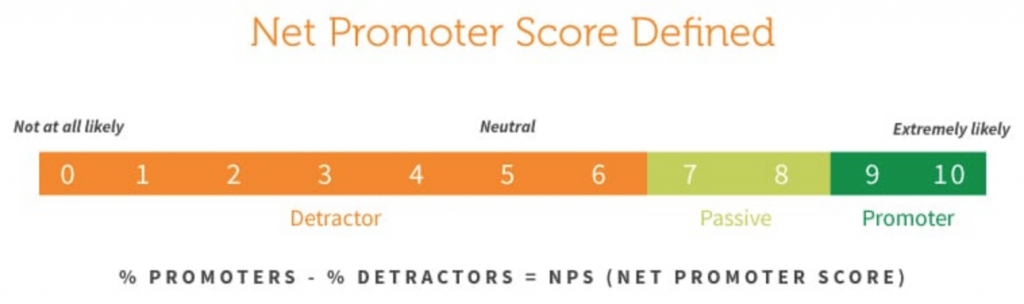
Based on these groups, you can calculate your final NPS. Net promoter score is the percentage of promoters minus the percentage of detractors.
% promoters − % detractors = Net Promoter Score
Let’s go through an example.
You get 10 NPS responses. First, count the number of promoters, passives, and detractors:
- Promoters: 5
- Passives: 2
- Detractors: 3
Then, look at what share promoters and detractors represent:
- Percentage of Promoters = (5 / 10) × 100 = 50%
- Percentage of Detractors = (3 / 10) × 100 = 30%
Finally, just subtract the % of detractors from the % of promoters:
NPS = 50% – 30% = 20
But what does that mean?
NPS benchmark data
The average NPS varies by industry. Here are the average scores for 23 industries according to Satmetrix:
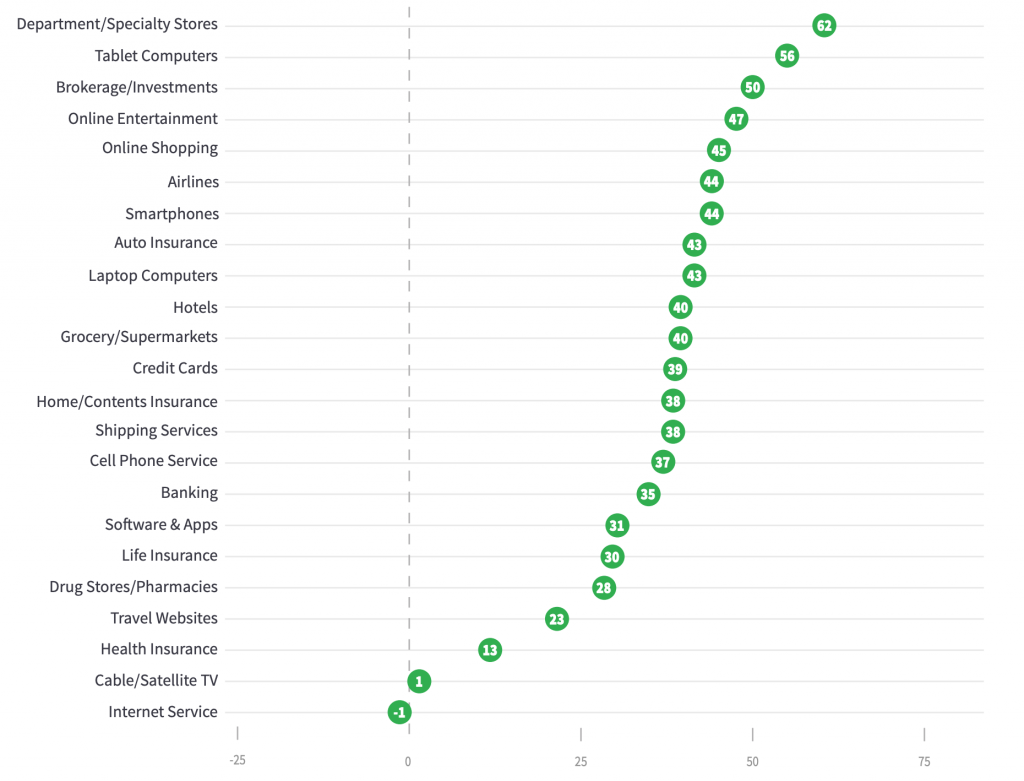
Technically, every company with an NPS over 0 is considered to have a good NPS score. However, if you’re aiming for a high NPS, +50 is generally deemed excellent, and anything over +70 is exceptional.
You’ll want to decide if you’ll assess your NPS score by absolute or relative terms.
The absolute approach looks at the NPS score as a standalone number, ranging from -100 to 100. It doesn’t compare this score to anything. Instead, it looks at it in isolation to determine the level of customer loyalty and satisfaction. For example, a positive NPS (above 0) is generally seen as good, above 50 is excellent, and above 70 is considered world-class.
The relative approach compares the NPS score to relevant benchmarks. That could include industry averages, direct competitors, or past performance. It provides more context to the score than the absolute approach. If no one in your industry scores above 50, that could mean scoring 60 would be exceptional.
Both approaches have their merit. Choose the one that best suits your business. Or, track both for additional insight.
Benefits of using NPS
There are three main benefits to using NPS:
- It points out areas of improvement in customer experience
- It’s an indicator of customer loyalty as well as satisfaction
- It allows you to identify and get to unhappy users fast and boost customer retention
Promoters of your company also help with referrals to potential customers and word of mouth marketing.
If you keep an eye on your passives and detractors and work on turning them into promoters, you’ll have even more people talking about you.
Beyond these three main befefits, there are a lot of other reasons to like NPS:
- It’s simple and easy to administer. It asks a single question that’s easy to understand.
- Its widely used and lets you benchmark against competitors and industry standards.
- It’s cost-effective. Compared to more robust market research, it’s almost free.
- It fosters communication between your team. Having a hard number reflecting customer sentiment lets you have real discussions about what different teams can improve. If you collect NPS feedback, you’ll know exactly what your issues are.
Drawbacks to NPS
There are also a few drawbacks to using NPS:
- It lacks specificity and often doesn’t tell you why customers are dissatisfied.
- It doesn’t factor in passive voters, meaning you might not consider their feedback if only looking at NPS
- It’s subject to timing issues. When you send someone an NPS customer survey can influence the score they give.
- It can be manipulated to boost scores. Selectively choosing when, where, or who to ask for feedback can skew scores.
You can overcome most of these by accounting for them in your setup. You’ll also want to make sure that NPS isn’t the only customer satisfaction metric you look at. Use it alongside other metrics to get a comprehensive view of customer sentiment.
How to implement NPS
There are a few ways to implement and collect NPS responses.
In-app surveys
An NPS survey is fairly easy to set up in your product, service, or website.
If you’re looking for an easy solution to start with, you don’t want to spend time on building a system from scratch.
Luckily, there are plenty of service providers for this:
At Canny, we use Wootric, and have found it perfect for what we need. Their solution is easy to set up, has a clean and easy- to-use interface, and provides ample reports for analysis of NPS data.
An important aspect of NPS is timing it right. Nobody likes having a survey pop up after signing into their account for the first time. You want to give your customers enough time to use the product or service before asking how they would rate it.
When it comes to frequency of the survey, keep it as sparse as you can. It’s nice to do it fairly regularly to see your score change, but it’s important to not let it get annoying. We suggest doing it no more than once a quarter per person.
The last thing you want is to frustrate a satisfied customer with too many survey requests. It could actually end up lowering your NPS results!
Collecting NPS responses via email
You likely won’t be able to reach all customers via in-app surveys. Maybe they don’t use your tool regularly. Or, maybe you don’t have an app.
In either case, emailing customers NPS surveys is a great option.
There are a number of tools that help you do this. Many of the ones listed above will, but here are a few dedicated tools:
- SurveyMonkey
- MailChimp
- Zoho Survey
- Simplesat
Make sure that whichever tool you use, you’re able to see how frequently you’re asking for NPS feedback. That should also include in-app surveys. One way to do this is to track each customer’s most recent NPS response in your CRM.
For example, Simplesat intregrates with Hubspot. This lets you see when each customer last responded to an NPS survey. Using that, you can automate your next in-app survey or email to send 3 months later. Make sure you’re not asking too often across both channels.
What would an NPS email look like? Here’s a good example:
Here’s what it does well:
- Has a clear subject line that states you’re asking for feedback
- It’s succinct and gets straight to the NPS question
- The NPS question is represented visually
- It’s branded and feels like it came from your company
Less is more with these emails. Customers are used to them, so you don’t need to reinvent the wheel.
Tailoring your NPS question
You can also slightly customize your NPS question to fit your company better and make it less generic. Zendesk has a great article about how to send an efficient NPS.
Here’s a handy table from that post about customization:
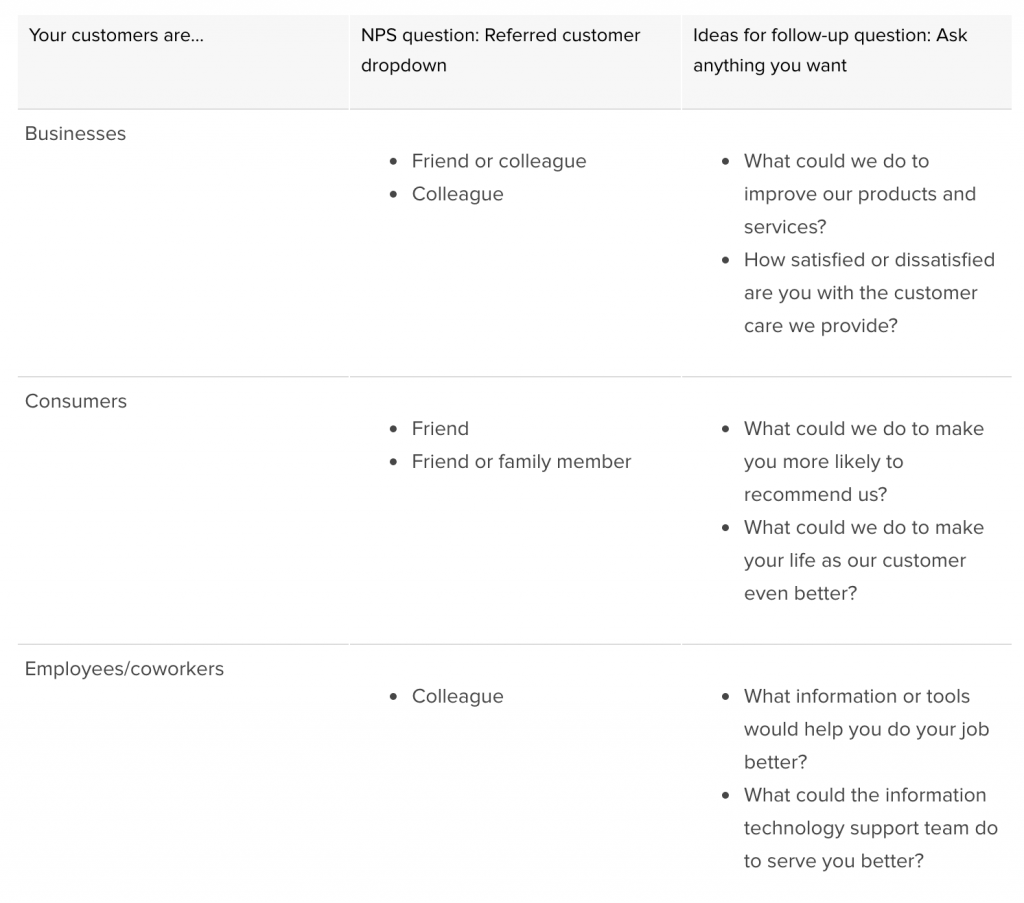
Net promoter surveys are pretty simple to begin with, but subtle customization will help you get more and targeted information from your responses.
Tracking NPS for different groups
You might also want to dive into NPS across various customer segments. Maybe you have happier customers that use one of your services. Or, customers who are early in the customer journey might respond poorly because there’s a problem with your onboarding.
NPS combined with data about your customer base is incredibly powerful.
Using an employee net promoter score (eNPS)
Let’s take a quick side trip here.
You might be surprised to hear that you can use NPS for employees too. The employee net promoter system can be really useful for measuring employee experience.
You can calculate it the same way as a regular NPS score, but it offers different information. eNPS is primiarly a barometer for employee sentiment. It will give you a sense of
- Job satisfaction — are your employees happy with their jobs?
- Employee retention — how likely are your employees to stick around?
- Company culture — do your employees like and respect the culture?
- Recruitment — how easy will it be to attract talent?
eNPS can be a valuable tool, but it does tend to oversimplify some complex issues. We recommend using it as part of a broader set of HR metrics.
What to do with the results
First of all — don’t worry if you come up with a low NPS at first. You’re learning, and there are ways you can deal with it.
As for what to do with the results, different score groups require different actions.
Promoters: use them to your advantage:
- Ask for reviews on GetApp, G2Crowd, Capterra, or similar
- Ask them for a testimonial or case study that you can put on your website and social media
- Point them to a referral program if you have one
Passives: try to turn them into promoters:
- Read why they chose that score
- If they didn’t specify, have customer service reach out and ask
- See if there are any quick wins to be had or fixes you can make that would make them change their score
Detractors: reach out urgently:
- Reach out personally, regardless of whether they gave an explanation or not
- Figure out what you can do to fix whatever made them give you a low score
Don’t forget to reach out to passives and detractors after you have made fixes or changes to your product or service.
Letting them know you listened to their feedback and took it seriously will increase their brand loyalty. They might even go back and change their score, which is a welcome result to see for your work.
It’s also a good idea to keep a regular track of your NPS so you can see how it changes over time.
How NPS works with other customer satisfaction metrics
NPS is a great place to start with tracking customer satisfaction. It’s easy for you to set up and customers to respond to. It gives you an easy to interpret metric and feedback on how to improve.
Combining it with other metrics provide you with a more comprehensive look at your customer experience.
Customer effort score (CES)
Customer effort score looks at how easily customers can use your service, get support, or find info they need. CES asks customers to rank how easy it was to resolve their issue from 1 to 7, with 7 being very easy. Ideally, you’ll have high CES scores and NPS. But, if they show different trends, it’s worth investigating.

For example, let’s say your NPS is great, but CES is low. That could mean your customers love your product, but find it difficult to get help.
Customer satisfaction score (CSAT)
Customer satisfaction score measures overall sentiment and satisfaction. Typically, you’d ask customers to rate their satisfaction from 1 to 5, 5 being very satisfied. The higher your scores, the more satisfied your customers are. That can indicate how likely your customers are to stick around.

You can use CSAT to look at specific interactions in the short-term, whereas NPS looks at broader long-term trends. This lets you identify if you have specific issues to resolve that haven’t shown up in NPS scores yet.
How do they work together?
Tracking all 3 of these metrics lets you track customer experience from different perspectives. Each of them can help you identify problems and improve.
For a more detailed look at using these three metrics check out our guide here.
Start with NPS for an easy first idea of customer satisfaction
NPS is an easy to implement first solution. It’s perfect when you’re just starting out with measuring user experience.
It gives you a quick general idea of what’s going on with customer satisfaction, and is an excellent source of general feedback.
You get the chance to reach out to unhappy users personally, make it right, and see the difference it makes to your bottom line.
Do you use NPS? What are some of the biggest improvements you’ve made based on survey results?