As a product manager, you know that keeping your customers happy is vital to the success of your business. But how do you know if your customers are actually satisfied?
The following three customer satisfaction metrics can help you gauge just that:
- NPS (net promoter score),
- CES (customer effort score),
- and CSAT (customer satisfaction score)
In this guide, we’ll look at each and see how product managers can leverage them to create a better CX.
What is customer satisfaction?
Customer satisfaction refers to how happy a customer is with your business. There are many factors that can influence customer satisfaction including:
- the quality of the product or service,
- the ease of use,
- the price,
- the level of customer service, etc.
Meet your customer’s needs and they’ll be more likely to come back and make repeat purchases. They’re also more inclined to recommend your company to friends and family.
The real magic happens when you exceed customers’ expectations. That’s when they’re not only returning for more but also telling everyone they know about you. When you do a very good job, these customers act like your brand evangelists and stay loyal for years to come.
When customers are unhappy with their experience, they may take their business elsewhere. In fact, according to Helpscout, only 1 in 26 customers tell a business if they were unhappy. The rest just leave.
Thus, it is important for companies to focus on measuring customer satisfaction. Paying attention to negative feedback can help identify areas of improvement. And thanking customers for their positive feedback makes them feel seen and heard.
Why use customer satisfaction metrics?
Customer satisfaction metrics are ways to track how your business meets customer needs. Improving them can help reduce your customer churn rate and improve customer loyalty. Both of which affect the bottom line.
Businesses can track a variety of metrics depending on how broad or granular they want their data to be. In general, customer satisfaction metrics fall into two main categories:
- Overall customer satisfaction. Metrics that provide a general overview of customer satisfaction levels.
- Detailed customer satisfaction. Metrics that provide specific data to help identify areas of CX that need to be improved.
Collecting and storing customer feedback with the right software is critical for businesses. But it’s not enough to only have the data. Businesses need to be able to analyze and act upon their data to make informed decisions.
That said, as a product manager, which metrics should you focus on collecting data for? Below, we’ll outline and explain three.
3 important customer satisfaction metrics for product managers
1. NPS
What Is NPS?
NPS, (Net Promoter Score) is a measure of how likely your customers are to recommend your business.
The score is based on a simple question:
“How likely are you to recommend our company/product/service to a friend or colleague?”
It’s a great indicator for measuring whether you have happy customers or unhappy ones.
Here is an example of Canny’s:
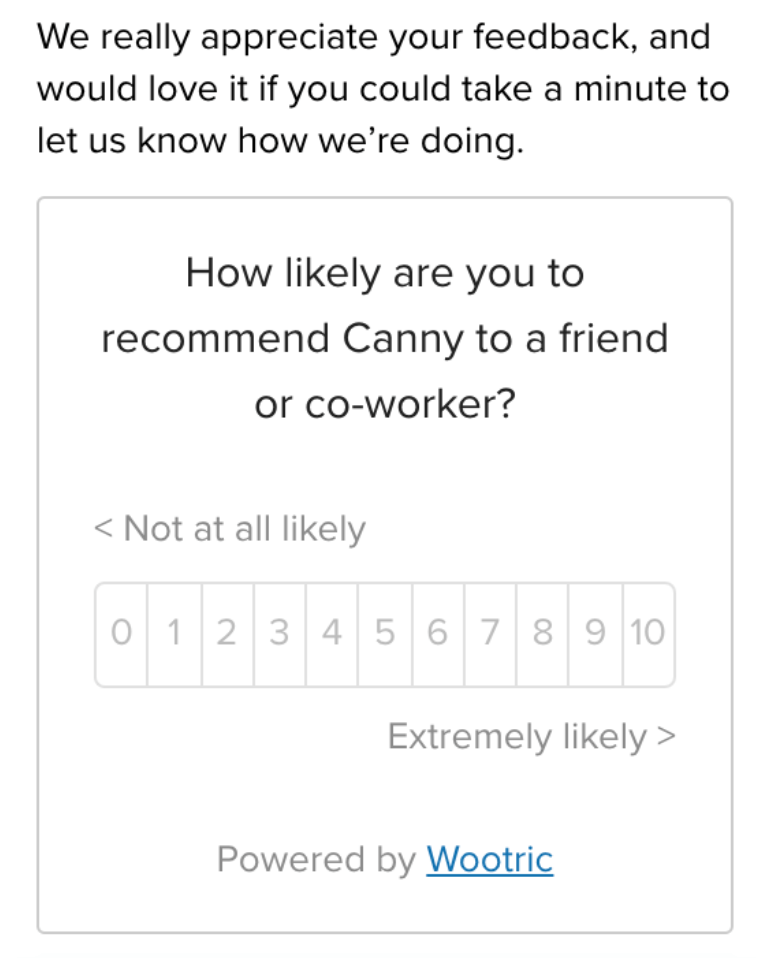
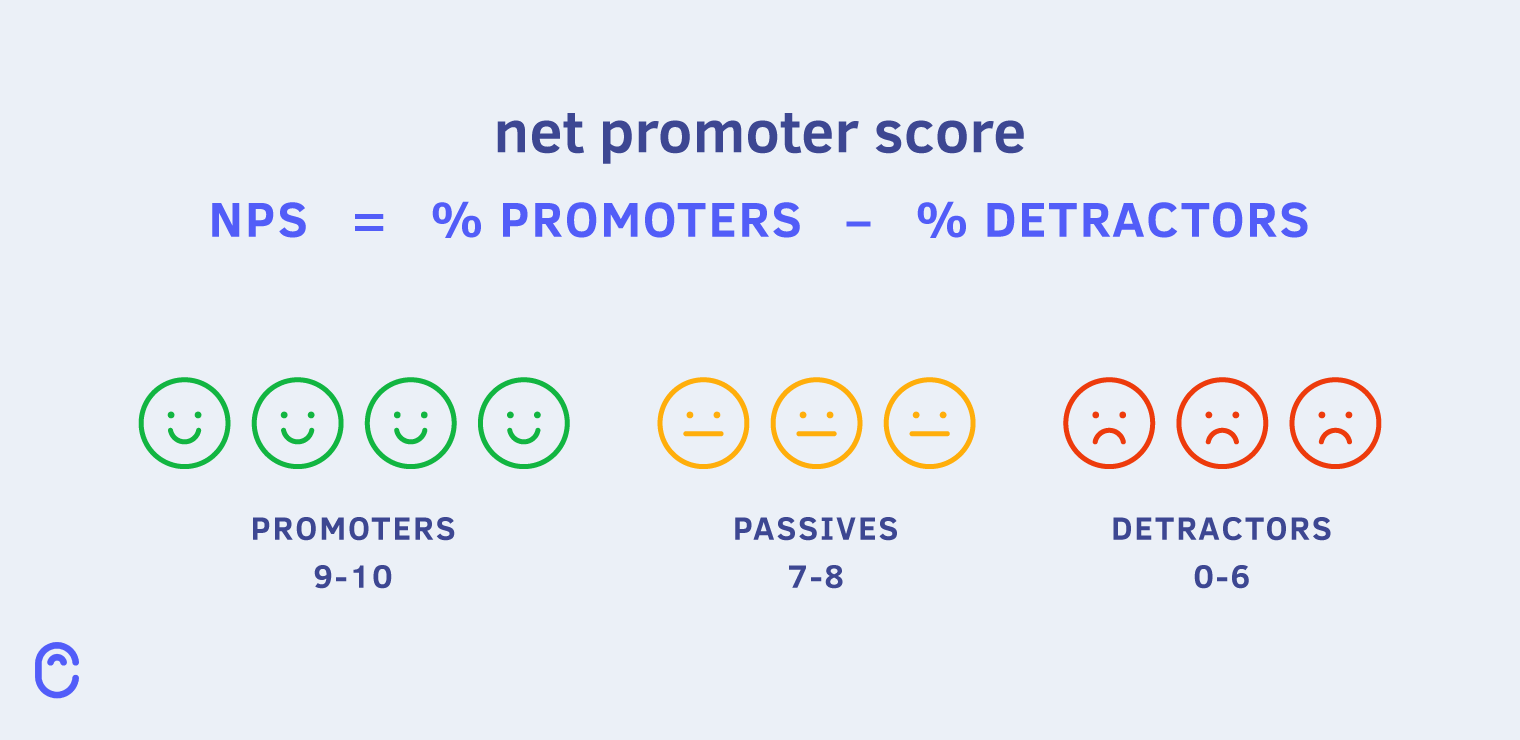
Customers usually respond on a scale from 0 (not at all likely) to 10 (extremely likely). Promoters are customers who choose with a score of 9 or 10. Passive customers are those who respond with a score of 7 or 8. Detractors are those who respond with a score of 0 to 6.

NPS example
To calculate your NPS, subtract the detractors from the promoters. Let’s say that a company collected an NPS survey from 100 customers and found the following:
- 40% were promoters,
- 30% were passive customers,
- and 30% were detractors.
The company’s NPS would be 10%, calculated as follows:
40% (promoters) – 30% (detractors) = 10%.
How product managers can leverage NPS
So what does NPS have to do with product management? As a product manager, one of your key objectives is to grow revenue. Whether it be through customer acquisition or retention.
NPS is a great leading indicator of both of those things. If you have a high NPS score, you’re acquiring happy customers. Your promoters are likely to stick around and refer you to others. These can be great customers to reach out to and ask for a written review or video testimonial.
Alternatively, if you have a low NPS score, that’s a sign you need to collect more data. You can do this by reaching out to the detractors and figuring out why they rated you low. Once you collect more data you’ll begin noticing patterns of concerns to address.
One thing to keep in mind for product managers is to segment their detractors. Focus on customers who use your product or service more or have a higher LTV. Focusing on issues related to low-frequency users may lead to inefficient resource allocation. This is not to say that you should ignore them. All feedback is valuable! But prioritize the feedback that will greater affect your business.
2. CES
What is CES?
Customer satisfaction is important for any business. Yet, it can be hard to gauge exactly how seamless your customer’s experience is. That’s where the CES (Customer Effort Score) metric comes in.
CES is a customer satisfaction KPI that measures how difficult it was to solve a customer’s issue.
If a customer has to go through many hoops with customer service, it’s likely won’t result in a high CES score. Things like:
- Being transferred to various departments
- Receiving a slow response time
- Being forced to re-explain an issue many times
To calculate a company’s CES, ask customers how difficult it was to solve their issue. A CES survey is usually measured using a Likert scale (a scale from 1 to -7). You can then use the results to identify areas of improvement for customer service.
But, CES doesn’t give a holistic view of customer service satisfaction. Thus, use it in conjunction with other metrics, such as NPS.
CES example
To calculate CES, you’ll need to survey your customers and ask them to rate their experience on a scale from 1 to -7. You can use other scales like emoticon ratings, but the Likert scale is most common.
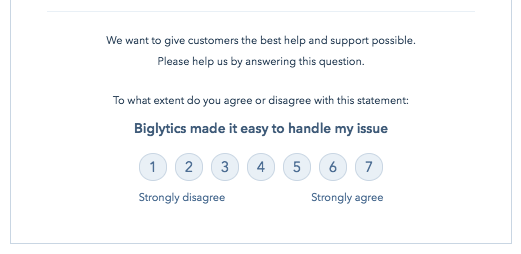
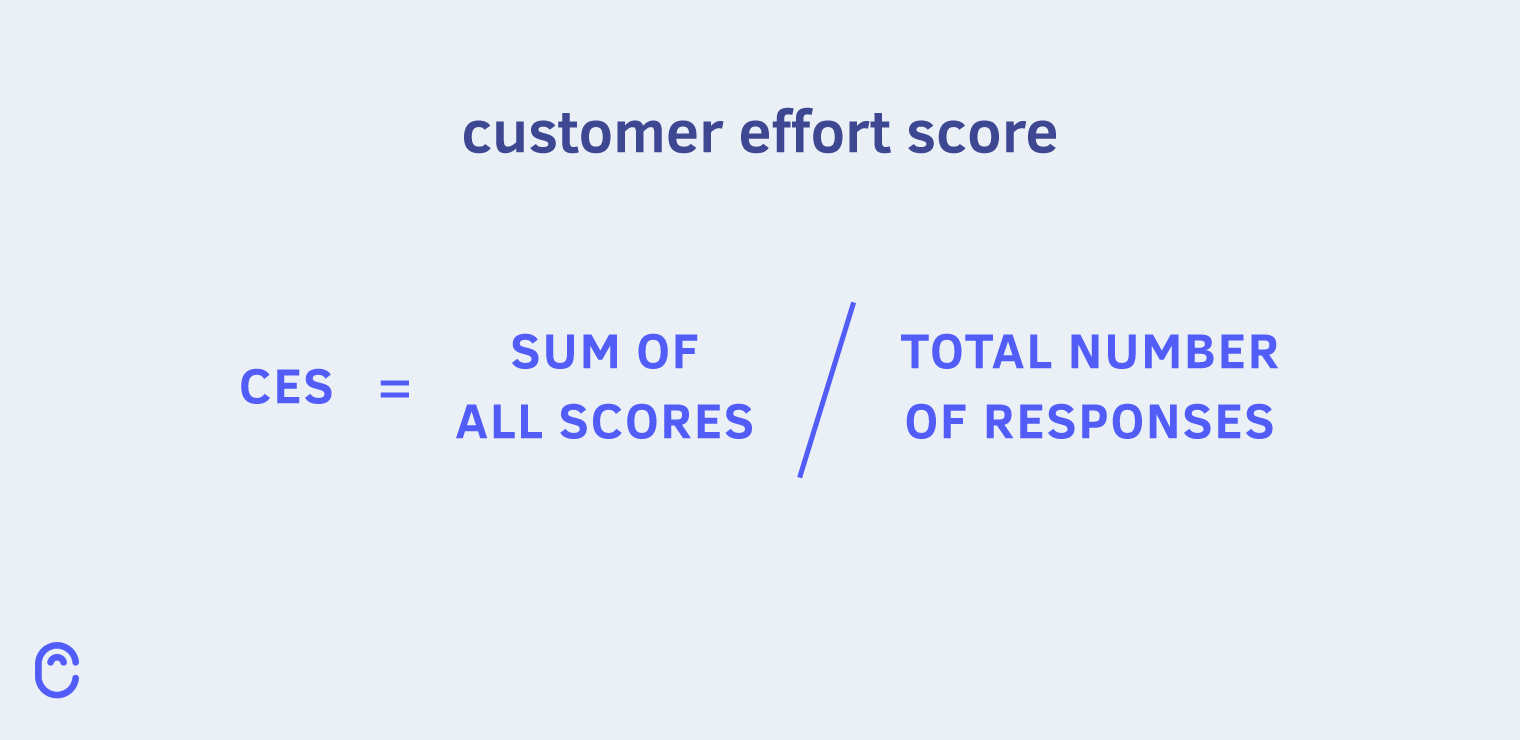
Then, you’ll take the total number of responses that answered 5, 6, or 7 divided by the total number of responses. Lastly, multiply that number by 100.

For example, let’s say you surveyed 100 customers and 70 of them answered either 5, 6, or 7. Then your CES score would be as follows:
70/100 x 100 = 70%
A high score means that your customers are satisfied with what they’ve received from you. If you have a low CES score, it means you need to make some improvements to your customer service.
Note: you don’t have to multiply the answer by 100. Depending on how you’re going to use the results, you may leave it as a decimal number too.
How product managers can leverage CES
Product managers aren’t usually directly involved with the customer service department. Yet, they can help identify opportunities to reduce post-purchase friction.
For example, let’s say your CES survey score is trending down. You also start noticing a pattern in customer feedback. Then maybe it’s time to assess whether you can improve your product or service. Perhaps an update can minimize the need for help?
Moreover, implementing tools like an AI chatbot can be an efficient way to help customers. Companies can build a chatbot in very little time to take away some of the load from the customer support team.
Whether your CES is trending up or down, it’s important for product managers to remain aware. They can determine whether to tweak the product or provide more information upfront.
3. CSAT
What is CSAT?
A business’s customer satisfaction (CSAT) score gauges overall customer sentiment and satisfaction levels. This number tells you how pleased your customers are with your product or service.
A high CSAT means your customers are more likely to come back in the future. A low score could mean that your business needs to make some improvements.
CSAT example
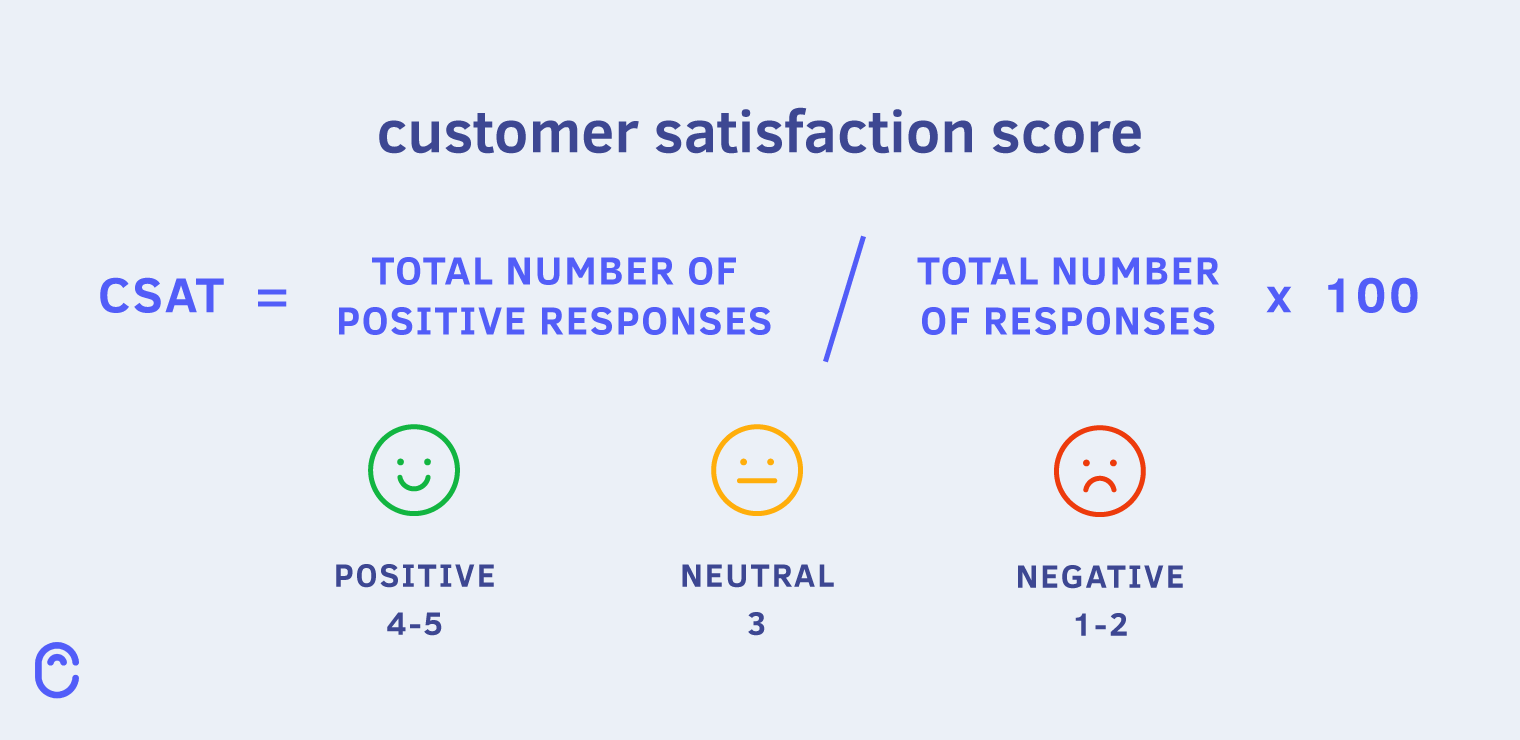
A common way to calculate CSAT is to ask customers to rate their level of satisfaction on a scale from 1 to 5. Then, take the number of the respondents that answered 4 or 5 and divide it by the total number of respondents. Finally, multiply that number by 100.
For example, let’s say you received responses from 100 customers. If 66 of those customers answered with either a 4 or 5, then your CSAT score would be:
66/100×100 = 66%.
The higher this number, the better.
How product managers can leverage CSAT
CSAT can give you insights into how your product or service is performing.
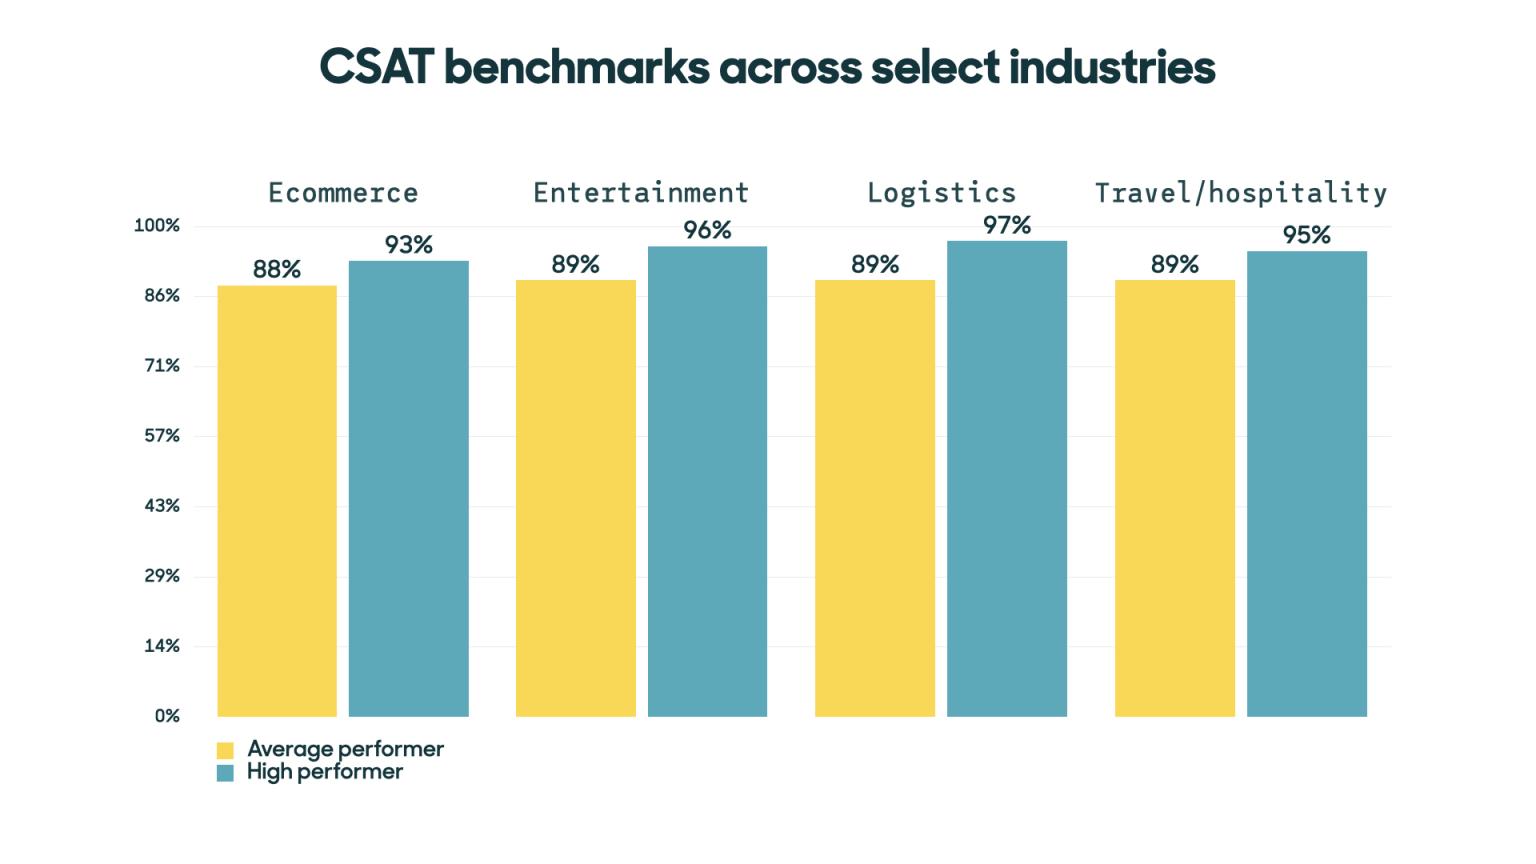
Tracking your CSAT can be helpful in identifying trends over time. Additionally, you can compare it to industry benchmarks. A good CSAT score will usually fall in the range of 75% – 85%.
Product managers can send a CSAT survey throughout parts of the customer lifecycle (for example, after new customer onboarding).
This provides clarity into whether you should tweak a stage in the customer journey.
CSAT’s downfall is that it is quite broad. It doesn’t provide much insight into which aspects of your business people are unhappy with. So, using it in conjunction with another customer satisfaction metric is ideal. Especially if you’re looking for a more granular understanding of customer sentiment.
Three key metrics
As a product manager, you’re constantly juggling different priorities. Balancing between meeting (and exceeding) customer needs and developing new features is tough. It’s impossible to get everything perfect. But these three key metrics should keep you on the right path.
Track these metrics to gather an accurate picture of how your business is performing. Finally, remember that you shouldn’t use these metrics as a gospel. Rather, use them as one tool among many when making business decisions.


