Product management is a complex task. It includes overseeing the entire product lifecycle. It also involves development, production, marketing, sales, and user feedback. That means collecting and analyzing a lot of data to make informed decisions.
This is where product dashboards come in. You can get a bird’s-eye view of your relevant KPIs and any key metric. But what should a product management dashboard include? And how do you use it to track product performance? This post will explain everything you need to know.
What is a product management dashboard?
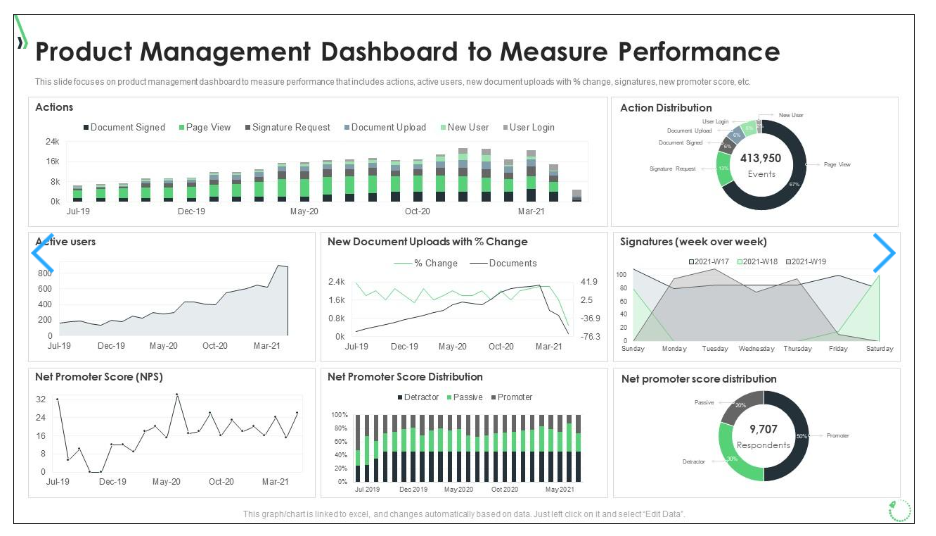
A product management dashboard brings together product data from your business systems. The visual display allows you and your product manager to view and track specific product metrics. Instead of searching for information within separate systems, dashboards provide a centralized overview.
Here’s an example. Do you want to get data on product quality and usage? And maybe you’re also interested in seeing how customer loyalty is performing? A product dashboard can help.
Dashboards also help your product team make data-driven decisions based on product analytics. For example, if you want to get data on product quality and usage, but are also interested in seeing how customer loyalty is performing, a product dashboard can help.
The main components of a dashboard will differ depending on product type and what you’re trying to find out.
With the right dashboard, you can also discover how your actions affect your product management metrics. Data in a visual format is easier to interpret. So this is ideal when you’re sharing it with stakeholders.
Now for the technical bit — how does a product management dashboard work?
- It moves raw data from different sources
- It transforms data into a usable resource
- It loads data into a database for end-users
As you can see, a product management dashboard can be a great tool. Next, we’ll take a look at how it can help with your product performance and how you can get the most out of your data.
How to track your product’s performance
Using a product management dashboard can be a great way to track your product performance. Here are a few things to consider to make sure that you achieve your goals and you can consistently improve.
1. Understand your goals
Before you get started on a product management dashboard, you need to know what you want to achieve. Look at your business objectives and how product management affects them.
Set specific and measurable goals for your product development. For example, let’s say you want to increase the conversion rate associated with the launch of a new product. You choose to put a figure and a timeframe, such as an increase of 10% in six months. Now, you’re ready to move on to the next step.
2. Check your data
Your dashboard won’t be able to give your product management team the actionable insights they need without reliable data. Identify where you’ll source the different types of data from. Consider how data currently flows between tools and systems. Are there any gaps in your information? Is all your data current and verifiable? Only working with trusted, accurate data can help you make the most of your product management dashboard.
3. Choose your KPIs
The key to an effective product management dashboard is to keep it simple. Don’t pull in every scrap of data, or the dashboard will get cluttered. Narrow your focus to the most relevant product management KPIs. For example:
Customer KPIs
- Customer Satisfaction Score/Net Promoter Score
- Customer retention rate/churn rate
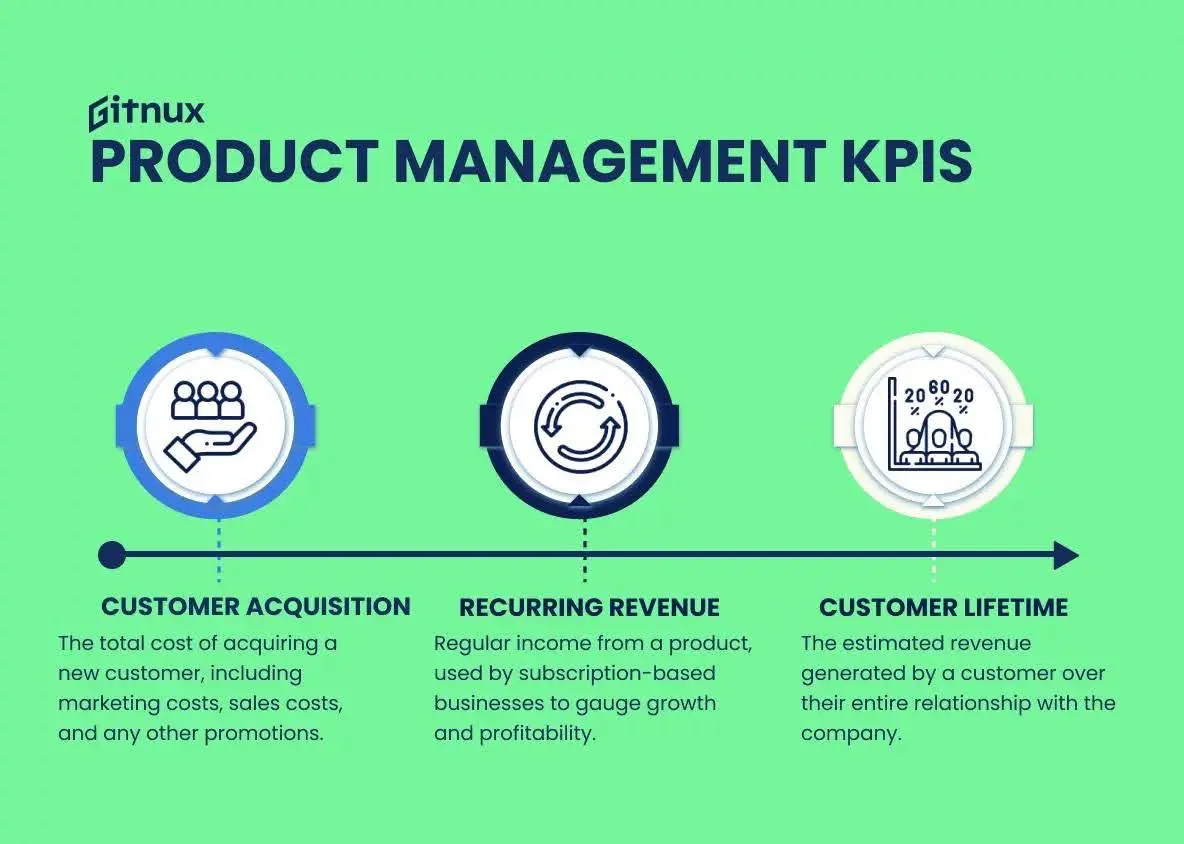
- Customer acquisition cost
- Customer lifetime value
Product quality KPIs
- Speed of development
- Active defect rate
- Number of support tickets per month
- Uptime (for digital products)
Product usage/user engagement KPIs
- Active monthly users
- Average session duration
- Time to adopt
- Product feature metrics
Business performance KPIs
- Monthly recurring revenue
- Average revenue per user
4. Create your dashboard
Once you’ve chosen your KPIs, create your product dashboard. There are several pre-built software solutions on the market, but you may also choose to build one from scratch for full customization. In this case, you’ll need specific tools. Think about data collection, data warehousing and integrations, and data visualization.
Step 1 – data collection. Gather the sources you’re going to use. For instance, you might be taking website data from Google Analytics and sales data from your CRM tool.
Step 2 – create a mock-up. This should focus on how you want the arrangement of the data to look in the final dashboard. You can do this with a simple spreadsheet. Its purpose is to act as a basic draft to work from.
Step 3 – data integration. Don’t worry too much about the technicalities. You don’t need to get into debating the merits of ETL vs ELT at this point. Use your existing data warehouse framework to feed the data through.
Step 4 – data visualization. You need your product analytics dashboard to be clear and easily decipherable. You can use a tool like Google Data Studio to present the data in an easily digestible form.
You can also create individual reports to feed into the dashboard. You should be able to create charts, filters, and extra columns.
You can arrange the display to suit your needs, too. For example, you might perform a SQL pivot row to column conversion. This turns the unique values from one column into individual columns.
5. Integrate your systems
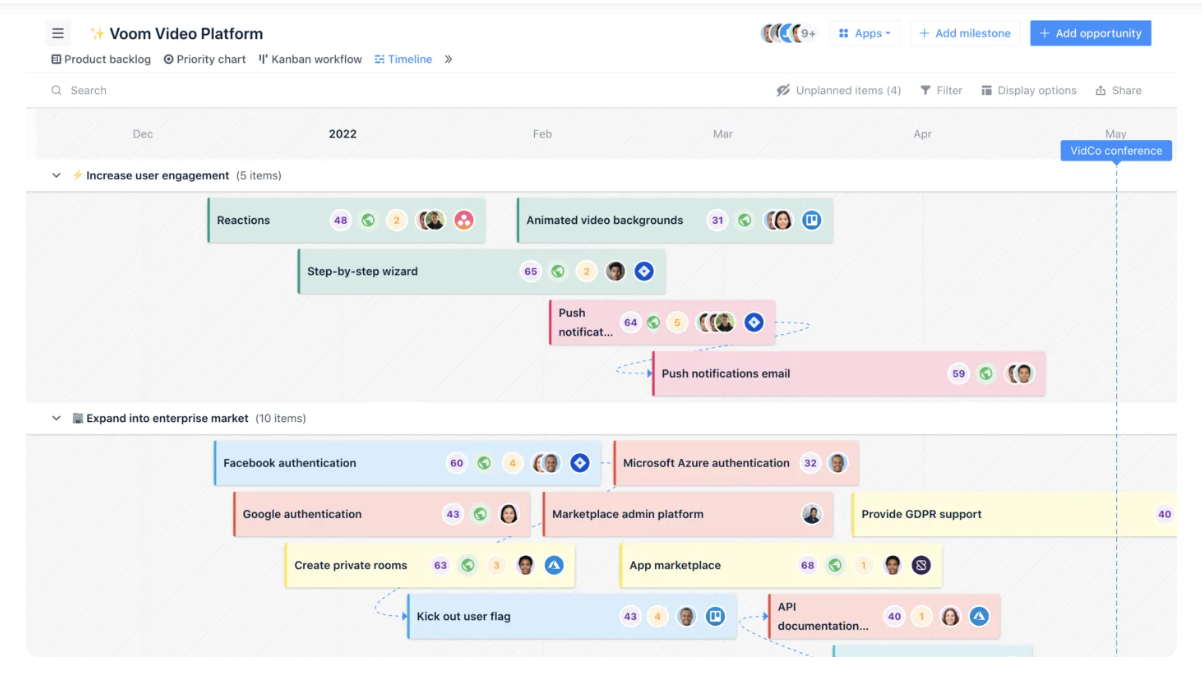
Some product management software covers all aspects of the process. Other tools focus on one aspect, like customer satisfaction, revenue, or user behavior, for example.
These come with built-in integrations, so you can bring many data points together. For instance, you might pull in data from your CRM, SEO analytics, and inventory software.
You could also use Supermetrics to automate data extraction and transformation. What is Supermetrics? It’s an API software that connects data from two programs and loads it into a data warehouse.
Make sure your dashboard is shareable and accessible. That way, product managers, team members, and stakeholders can view it.
The dashboard design should be clear and user-friendly. Take time to train users on how to interpret the data and make the most of it.
7. Keep measuring progress
A product management dashboard isn’t something you can set up and forget. You must check it on a regular basis to see real-time data and patterns over a period of time. That way, you can spot problems before they blow up and find ways to improve your product strategy and overall product success.
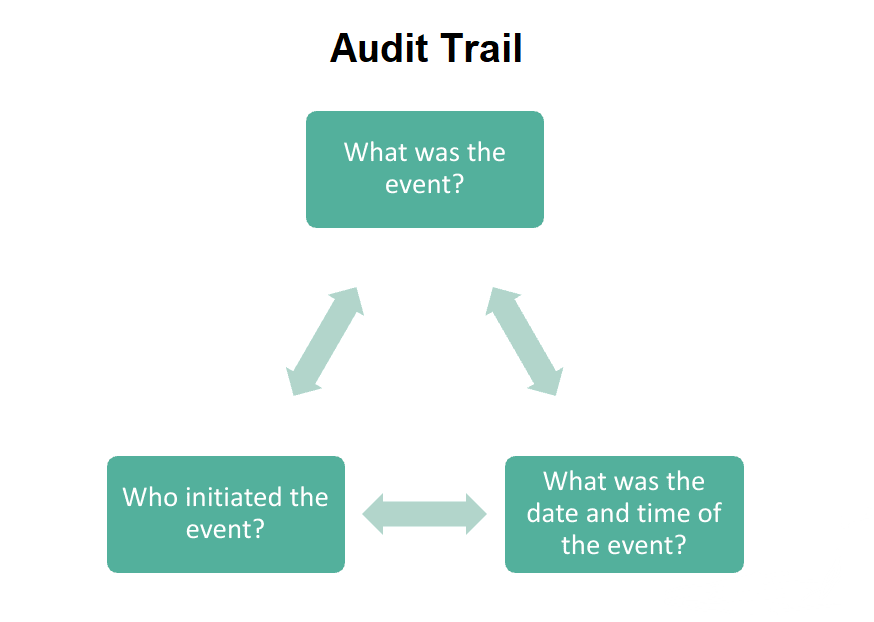
It’s also worth running an audit trail to track your processes. What is an audit trail? It’s a chronological record that tracks all events in a project. You can look back and see how well everything worked and verify data accuracy.
Improve performance with a product management dashboard
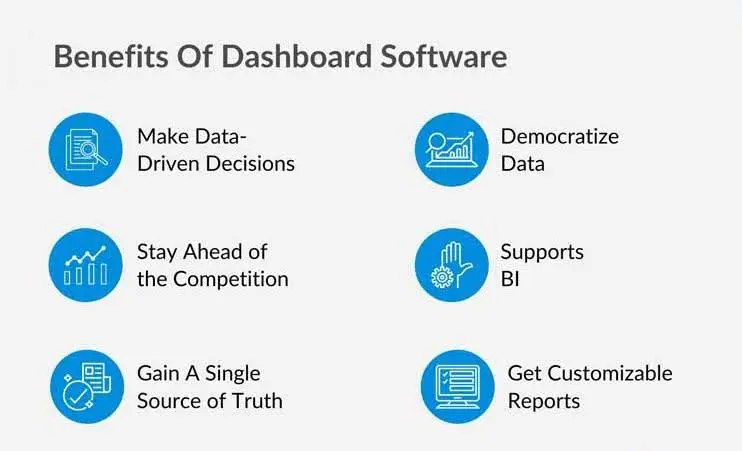
A custom dashboard is the most efficient way to handle product management performance tracking. With relevant business metrics in one place, you can make informed product decisions.
Want to boost your product career? Check out the top product management certifications.
Product management dashboards save time and reduce manual work. They also help to break down silos by making crucial information available to all stakeholders regardless of what team they work in. The data is accessible, and the visual format is easy to understand.
You might use a pre-built solution or create a dashboard from scratch. Either way, you’ll be able to provide better user experiences. And you’ll meet your product management goals.


